


In trading on Friday, shares of Nike crossed above their 200 day moving average of $71.77, changing hands as high as $72.84 per share. Nike shares are currently trading up about 14.8% on the day.
10 Stocks Crossing Above Their 200 Day Moving Average »
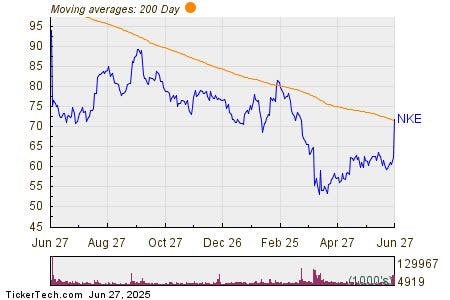
The chart below shows the one year performance of NKE shares, versus its 200 day moving average:
Looking at the chart above, NKE’s low point in its 52 week range is $52.28 per share, with $90.62 as the 52 week high point — that compares with a last trade of $71.53. The NKE DMA information above was sourced from TechnicalAnalysisChannel.com
Read the full article here


