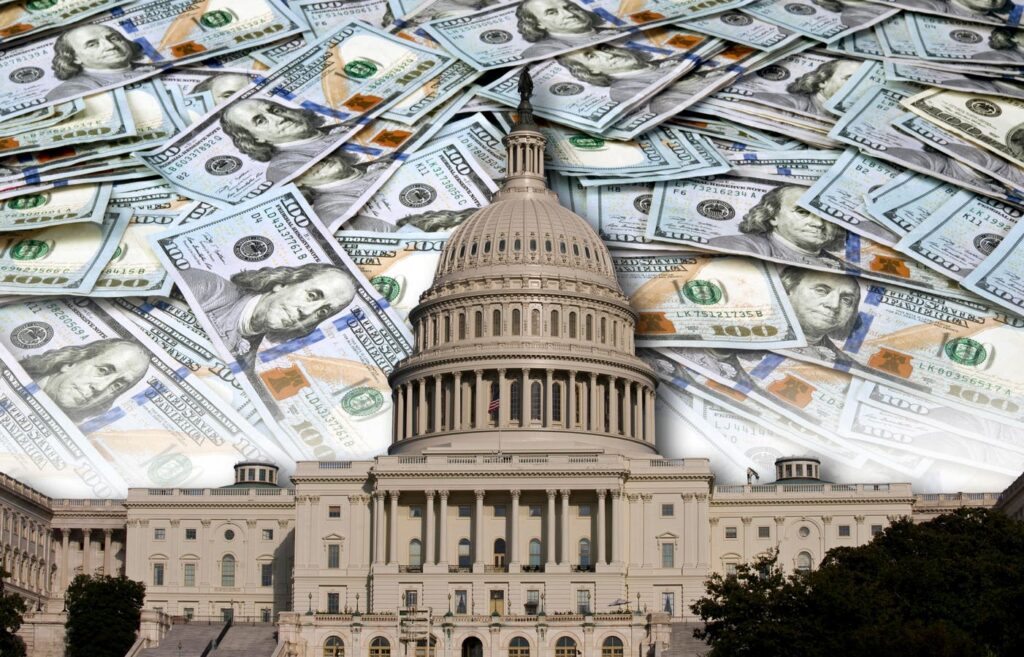
In a not-so-surprising move, the rating agency Moody’s has downgraded the credit quality of the U.S. to AA1 from AAA. This recent action reflects the ever-growing concern over America’s budget deficits and exploding debt. With a national debt approaching $37 trillion due to years of excessive spending, some believe the financial strength of the U.S. is weakening. As you continue reading, it should become clearer why Moody’s has taken this action.
A country’s debt is often measured against its economic growth or GDP. This is called the debt-to-GDP ratio, which for the U.S. was 35.39% in 1980, 57.11% in 1990, and 59.55% in 2000. It then rose to 73.41% in 2008, and 118.64% in 2020. Currently, it stands at 133.35%. To state it another way, the national debt is about 33% greater than GDP. The debt-to-GDP ratio is like an individual’s debt-to-income ratio; in that it provides insight into a person’s ability to repay money they have borrowed. In the case of the federal government, decades of excessive spending by elected officials have pushed this ratio to record levels.
Federal Revenue vs. Spending
The following chart shows how federal spending has exceeded revenue for decades. If you look closely, you’ll see how spending began to outstrip revenue around 1974. This is largely due to abandoning the gold standard, which in effect removed the ceiling for spending. In other words, Congress could spend as much as it wanted, which changed the political landscape forever as political favors became a greater focus than fiscal responsibility.
Note how spending rose to over $3.5 trillion during the financial crisis while revenue fell to $2.1 trillion. This created one of the largest fiscal deficits in U.S. history of around $1.4 trillion. The largest U.S. fiscal deficit was $3.1 trillion in fiscal year 2020, during the global pandemic. At that time, spending soared to $6.5 trillion while revenue was only $3.4 trillion.
How Did the National Debt Get So Large?
It’s easy to see how excessive spending by Congress created such a large national debt. The total of all deficits from the end of the pandemic (2009) through fiscal year ending September 30, 2024, is $20.5 trillion. Remember, all deficits are added to the debt, which was $11.7 trillion in 2009. If you add the $20.5 trillion in budget deficits since 2009 to the $11.7 trillion in debt, then add a splash of interest on the debt, it’s not hard to see how the current national debt is nearly $37 trillion.
Federal Spending in Focus
For a closer look at Congressional spending, let’s refer to the following chart. Note how spending was $2.72 trillion in fiscal year 2007, just as the financial crisis emerged. Two years later, in 2009, spending had risen to $3.51 trillion. Spending remained rather flat for a few years until the global pandemic. Then, Congress seized the opportunity to spend more in supporting the economy during a time of crisis. Congressional spending rose from a level of $4.4 trillion in 2019 to a staggering $6.5 trillion in 2020, an increase of $2.1 trillion in 12 short months. For perspective, the increase of $2.1 trillion in spending is about 78% of total Congressional spending during fiscal year 2007.
Logic would suggest that after the pandemic, spending would decline to pre-Covid levels, but this was not the case. After reaching an all-time high of $6.8 trillion in fiscal year 2021 (not labeled in chart), spending fell slightly over the next two years. In fiscal year 2023, spending was $6.1 trillion. In fiscal year 2024, spending rose to $6.7 trillion.
As mentioned, each budget deficit is added to the national debt, which is quickly approaching $37 trillion. According to USDebtClock.org, this debt equates to about $107,692 per citizen or $323,050 per taxpayer. If the current levels of spending and revenue remain at $7.1 trillion and $5.1 trillion respectively, the federal budget deficit would be about $2.0 trillion by September 30, 2025, the date when the current fiscal year ends.
The president’s proposed tax plan is expected to increase the deficit by an estimated $4-6 trillion or more over the next decade. Filled with tax reductions and reduced regulations, it’s hard to say exactly how Trump’s plan will affect the deficit and debt. Why? Because it’s hard to predict how economic growth will be affected. If the economy booms as the president has suggested, the deficits may not be as large. This is a key reason why estimates are so varied.
There is certainly a great deal of uncertainty in the U.S. economy. However, it’s clear that the problem in Washington resides in the excessive spending by our elected officials. Though President Trump has been a disrupter in Washington – something that needs to be done if we’re to get our fiscal house in order, what’s less certain is how effective the effort will be, how much pain American’s must endure, and how long it will take to bring about a more lean, efficient federal government. No one should argue against making the government more effective. The real argument is in how to accomplish the task. And that’s where the divide is occurring.
Read the full article here

